



The alternative asset management industry has evolved significantly over the past decade. Growth across the sector has been particularly impressive, driven by powerful secular tailwinds that remain firmly in place today. As a result, I believe the private markets will continue to experience strong growth and adoption in the years ahead.
However, certain segments of the market have raised and deployed substantial amounts of capital into an increasingly concentrated opportunity set. The result has been greater competition for assets, and in many cases, a more challenging environment for generating excess return. In my view, these supply-and-demand dynamics are among the most important drivers of long-term alpha generation.
The lower-middle market remains a notable exception. I think this is driven by two factors: an investable universe that is multiple times larger than the upper-middle market and significantly less capital being raised and deployed into this market segment.
A few statistics to put this into perspective: per S&P Capital IQ, there are currently 85,000+ commercially active U.S. businesses with revenues totaling $10-$250 million, relative to less than 7,000 businesses with revenues greater than $250 million.1 The GP ecosystem is similarly expansive: approximately 1,000 GPs manage approximately $3 trillion across this lower-middle market opportunity set, which is more than five times the number of GPs at the upper end of the market.
Furthermore, according to PitchBook, private equity dry powder for funds greater than $1 billion totals ~$780 billion, compared to $150 billion of dry powder for funds totaling $250 million to $1 billion.2 These supply-and-demand dynamics create a bifurcated investment environment within private markets. In the lower-middle market, this results in significantly less competition for assets, meaningfully lower leverage levels, more attractive entry multiples, and a distinct opportunity to drive value.
Another observation is that many industry participants define the lower-middle market primarily by company size. While size is certainly an important consideration, I believe it is equally important to understand the nature of this end market.
In many respects, lower-middle market businesses are the backbone of the economy, spanning sectors like manufacturing, industrials, skilled trades & services, transportation & logistics, and business services. Across these sectors are tens of thousands of growing companies, creating local and regional jobs and, importantly, these businesses have a direct impact on local economies. So, as a capital provider to these companies, the impact is far greater than just writing a check.
At our U.S. lower-middle market private equity business, RCP Advisors, we have spent 25 years investing in this market. Today, RCP has more than $19 billion3 in committed capital across 610+4 partnership investments, providing exposure to more than 3,700 portfolio companies. These businesses represent thousands of entrepreneurs, management teams, and employees throughout the country. That’s a remarkably broad reach, in my view.
I believe these characteristics underpin the long-term attractiveness of the lower-middle market. Combined with our multi-decade track record, incumbency, and expansive collection of data, the opportunity set at Ridgepost Capital remains compelling.
Here at Ridgepost Capital, track record, incumbency, and data are central to everything we do. Several of our strategies have been investing in their respective markets for decades, with some of our franchises dating back as far as the 1980s. These track records of consistent outperformance, as well as the benefits of incumbency in the lower-middle market, are incredibly beneficial to our company for numerous reasons, but what is equally (or even more) important is the data we’ve collected across these businesses over the past several decades.
We employ a proprietary data set covering 6,700+ investment firms, 10,800+ investment funds, 53,000+ individual transactions, 35,000+ private companies, and 478,000+ financial metrics. This dataset provides our teams with unique and differentiated reference points, ultimately informing how we source transactions, evaluate managers and companies, benchmark performance, and recognize patterns in a part of the market where data and information generally are limited.
Putting all of this together, what does it ultimately mean for investment performance in the lower-middle market? I think it creates the necessary conditions for sustained alpha generation.
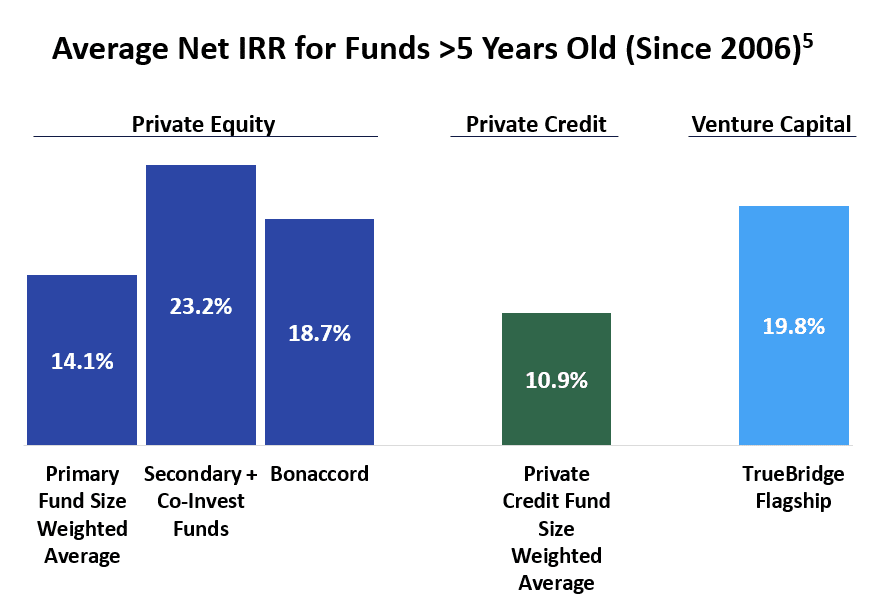
Looking at the net IRRs for our funds that are greater than five years old (since 2006), as of September 30, 2026, Private Equity Primary Funds have averaged 14.1%, while Secondary and Co-Invest Funds have averaged 23.2%. Our GP Stakes funds at Bonaccord have averaged 18.7%, our Venture flagship funds at TrueBridge have averaged 19.8%, and our Private Credit strategies have averaged 10.9%.5
Given Ridgepost Capital’s leading position in the lower-middle market, I think we are uniquely positioned to deliver differentiated performance for our investors moving forward, which is the foundation of our long-term growth flywheel. So, at $50B+ of AUM today, I see tremendous opportunity ahead as we push forward on scaling an industry-leading alternative asset manager in the lower-middle market.
Capital will continue to flow into the alternative asset management industry. The more important question is where excess return can still be found. I believe the answer remains the lower-middle market.
Disclosures
- Source: S&P Capital IQ. Commercially-active businesses in the U.S. All subsidiary and business establishment data are combined. Additionally, public sector entities are excluded. As of 7/28/2026. ↩︎
- Source: PitchBook. Capital available to invest by fund size represents U.S. private equity overhang for vintage years 2018-2025. U.S. PE Funds: includes buyout, growth, co-investment, mezzanine, diversified PE, energy, and restructuring. As of 12/31/2025. ↩︎
- Source: RCP Advisors. As of 6/30/26. “Committed capital” primarily reflects the capital commitments associated with our SMAs, focused commingled funds, and advisory accounts advised by RCP since the firm’s inception in 2001 (including funds that have since been sold, dissolved, or wound down). We include capital commitments in our calculation of committed capital if (a) we have full discretion over the investment decisions in an account or have responsibility or custody of assets or (b) we do not have full discretion to make investment decisions but play a role in advising the client on asset allocation, performing investment manager due diligence and recommending investments for the client’s portfolio and/or monitoring and reporting on their investments. For our discretionary SMAs and commingled funds, as well as for our non-discretionary advisory accounts for which RCP is responsible for advising on all investments within the client’s portfolio, committed capital is calculated based on aggregate capital commitments to such accounts. For non-discretionary accounts where RCP is responsible for advising only a portion of the client portfolio investments, committed capital is calculated as capital commitments by the client to those underlying investments which were made based on RCP’s recommendation or with respect to which RCP advises the client. Committed capital does not include (i) non-discretionary advisory accounts no longer under advisement by RCP, (ii) assets managed or advised by the Private Capital Unit or HB Units of RCP 2, (iii) capital commitments to funds managed or sponsored by RCP’s affiliated (but independently operated) management companies, and (iv) RCP’s ancillary products or services. ↩︎
- Refers to RCP’s discretionary investments. ↩︎
- Please see performance summaries and disclosure slides in the back of our Third Quarter 2026 Results presentation and our Legal Disclaimer. Net IRRs include the following funds — Primary: Funds III-XIV and SEF I and II, Qualitas I-IV; Secondary + Co-Invest: RCP SOF I-III , RCP SOF III Overage and RCP Direct I-III; Bonaccord: Funds I, II (2022 vintage) and Co-Invest (2022 vintage); Private Credit: Enhanced Project Finance and Small Business Lending vehicles, Hark Funds I-III, WTI Funds V-IX, Five Points Credit Funds I-III, Stellus Funds I-II; TrueBridge Flagship: Fund I-VI. Past performance does not guarantee future results. There is no guarantee that an investment with Ridgepost Capital will be successful. ↩︎
Nothing herein constitutes an offer to sell, or a solicitation of an offer to buy, any security. For additional information, please visit www.ridgepostcapital.com. For more disclosures, please read our Third Quarter 2026 Results presentation and our Legal Disclaimer.